Background
Frequently, in public discussions about sustainability, focus is placed on the responsible use of natural resources and on their protection for future generations. Not infrequent however, left out from these discussions is the inability of certain groups in the present generation to meaningfully access the current societal resources (and not just the natural). In its definition of sustainability the Earth Charter places an emphasis on “universal human rights,” and on “economic justice.”
According to 2010 data from the US Bureau of Justice, we have the highest rate of incarceration in the world with a total of 7.25 million people under correctional supervision. Of them, 2.25 million are incarcerated, and 5 million are in probation or parole programs. Studies indicate that 40 percent of these people return back to correctional supervision three years after returning to their communities, and that a disproportionate number of them is concentrated in very few neighborhoods. These neighborhood concentrations then, translate into large amounts of public spending that are used to incarcerate the residents of a few neighborhoods, and to support their families and children left vulnerable. With improved policies focused on crime prevention and rehabilitation (rather than on crime punishment), this public spending could perhaps be better used by investing in these neighborhoods and in the ability of their residents to better access societal resources. (1).
Area of Focus: Alachua County
In Alachua County, the average household size is 2.32 people. In 2010, the Federal government set the poverty line for households of four with an annual income of less than $22,050. In the 2010 census, the unemployment rate was 7.9% (2) with 23.6% of the county below the poverty line. In addition, 44,285 children out of 247,336 in Alachua County fall into the poverty category. The School Board’s data shows ~50% of the children in free meals programs, with ~25% of them in Food Stamps or other welfare programs (i.e. under the federal poverty line). At any given time, there are approximately 400 homeless children 400 in foster care (1,2)
Objectives
The primary objective of this study is to identify vulnerable areas within Alachua County using GIS data. The study was broken up into four different components: Education, Socioeconomic factors, Crime, and Quality of life. There were certain criteria that an area had to include in order for it to be deemed a vulnerable area. The area had to have:
- Poor educational standards (low levels of graduation)
- Low income households
- High rates of crime
- Few amenities available (public and private)
Methodology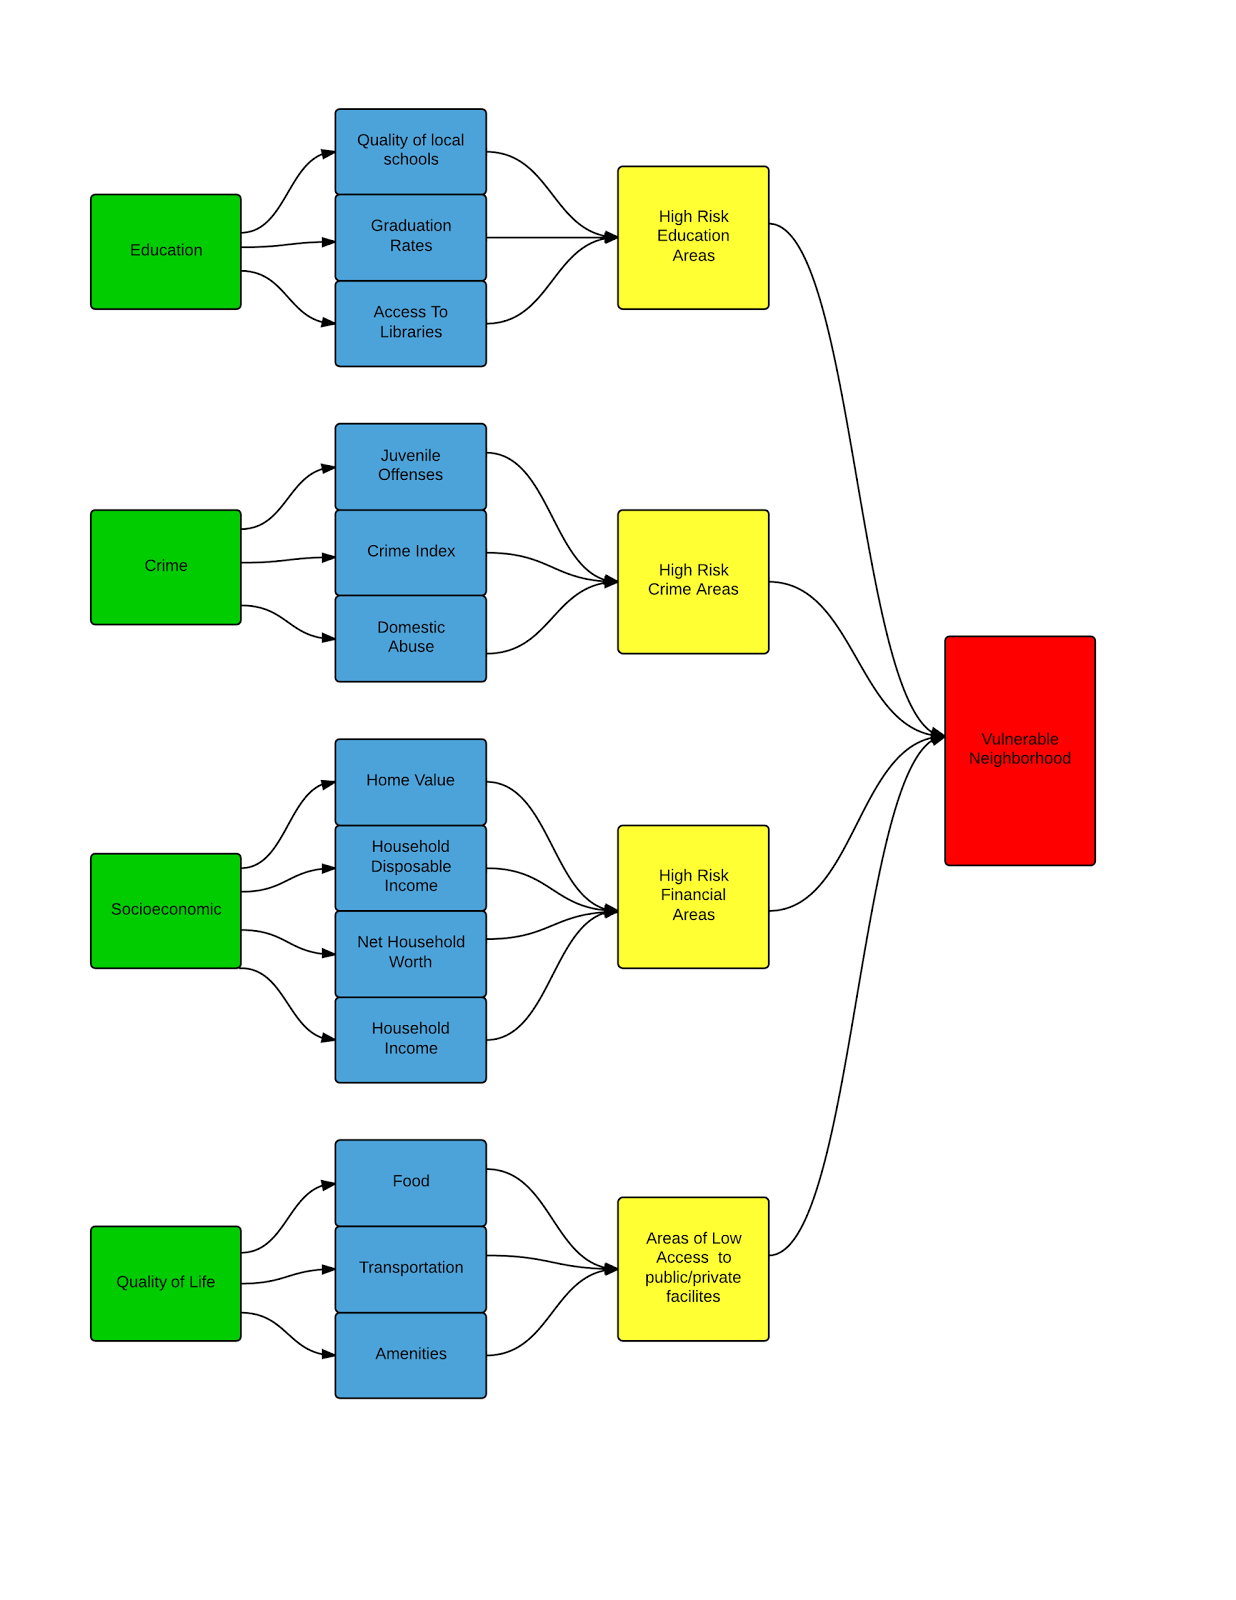
This flowchart visually explains the thought process behind mapping vulnerable neighborhoods.
Criteria 1: Education
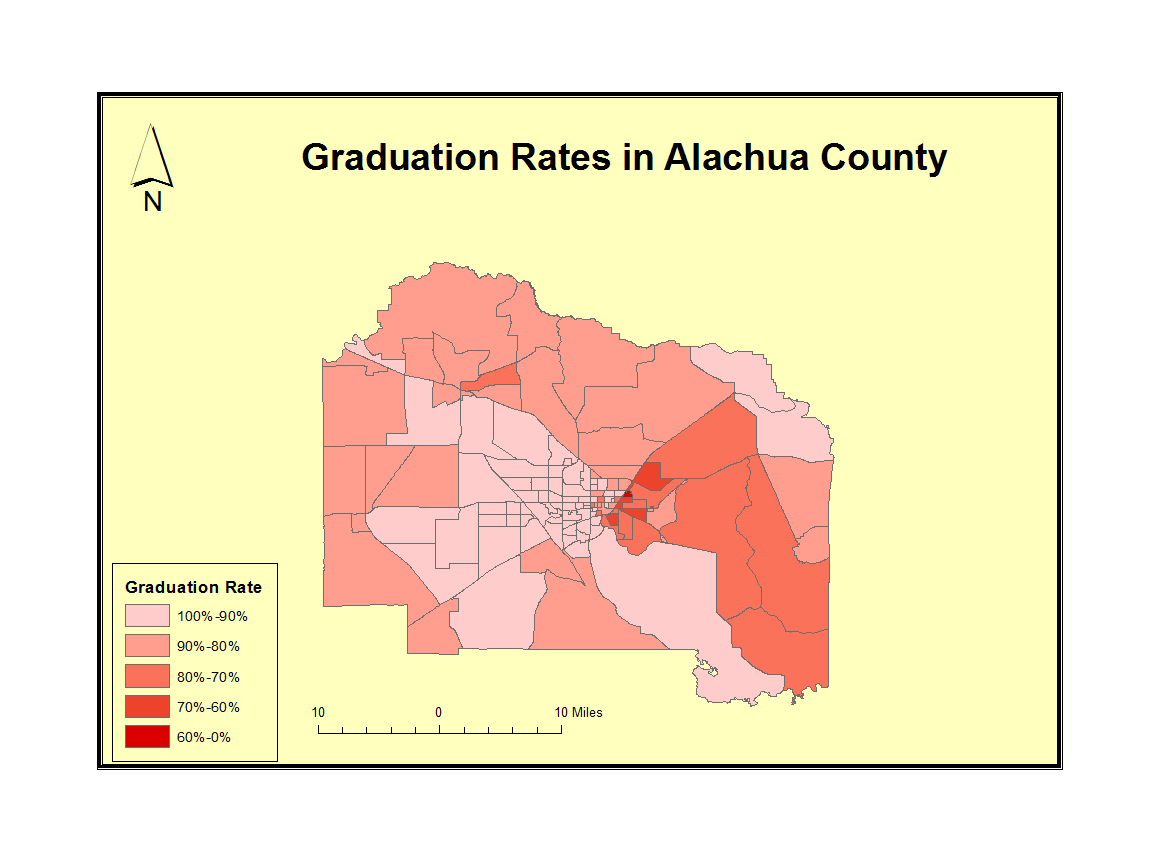
In looking at high risk students based on education we feel we must look at several different factors to determine the areas that children are at risk throughout Alachua county. First we looked at the graduation rate of students at certain levels (High school, College, etc.). To do this we took the information that was provided in the "Some high school by block group" layer to divide the total number of high school and college graduates by the total number of students in each block group using the field calculator in a new field. We then separated the percents into five levels giving each a risk level in a new field in the attribute table [1(100%-90%), 2(89%-80%), 3(79%-70%), 4(69%-60) 5(59%-0%)].
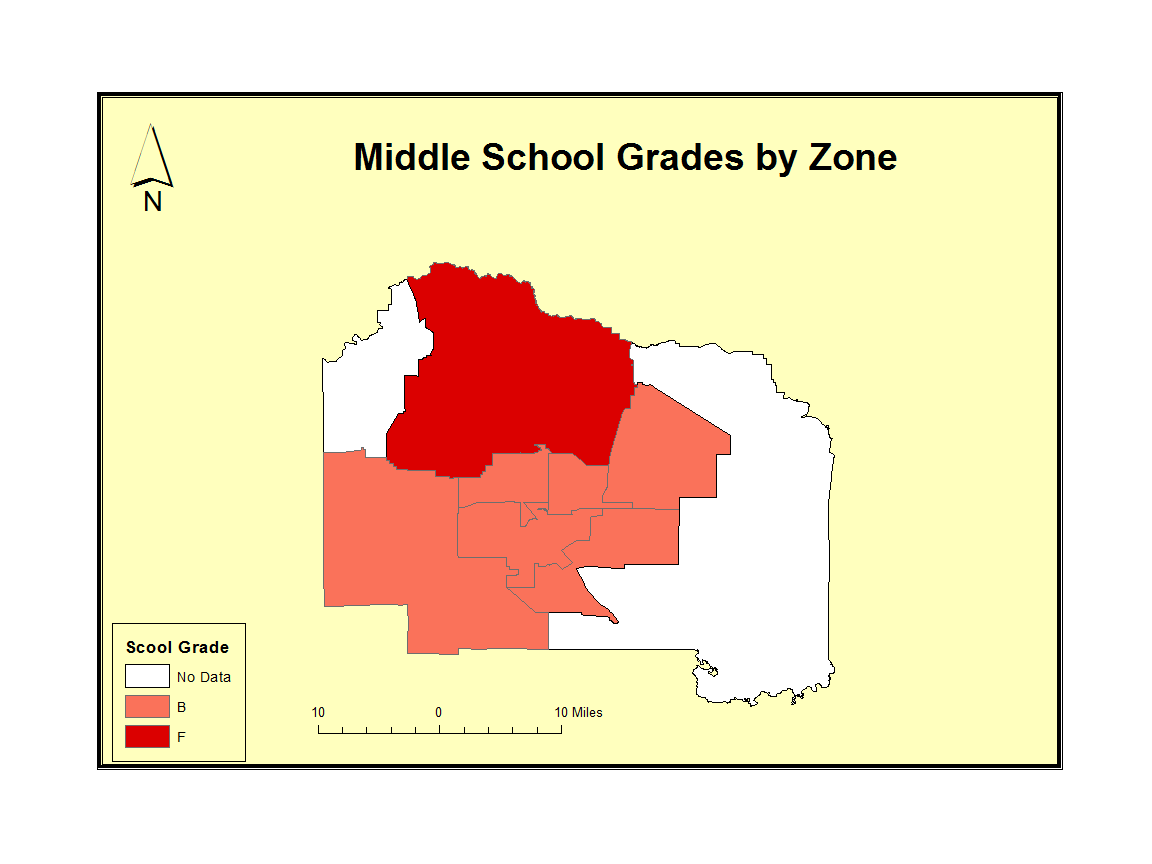
 Due to some schools not being as high quality as we'd hope they could be there will also be consideration given to the grades of the school. To judge this we took the data provided by http://www.sbac.edu/files/_wGByv_/0060acc65d632cc83745a49013852ec4/SchoolGradesHistory.pdf to add the schools grades to the Elementary, Middle, and High school zone layers. We then gave each grade a risk level in a new field in the attribute table [1(A), 2(B), 3(C), 4(D), 5(F)].
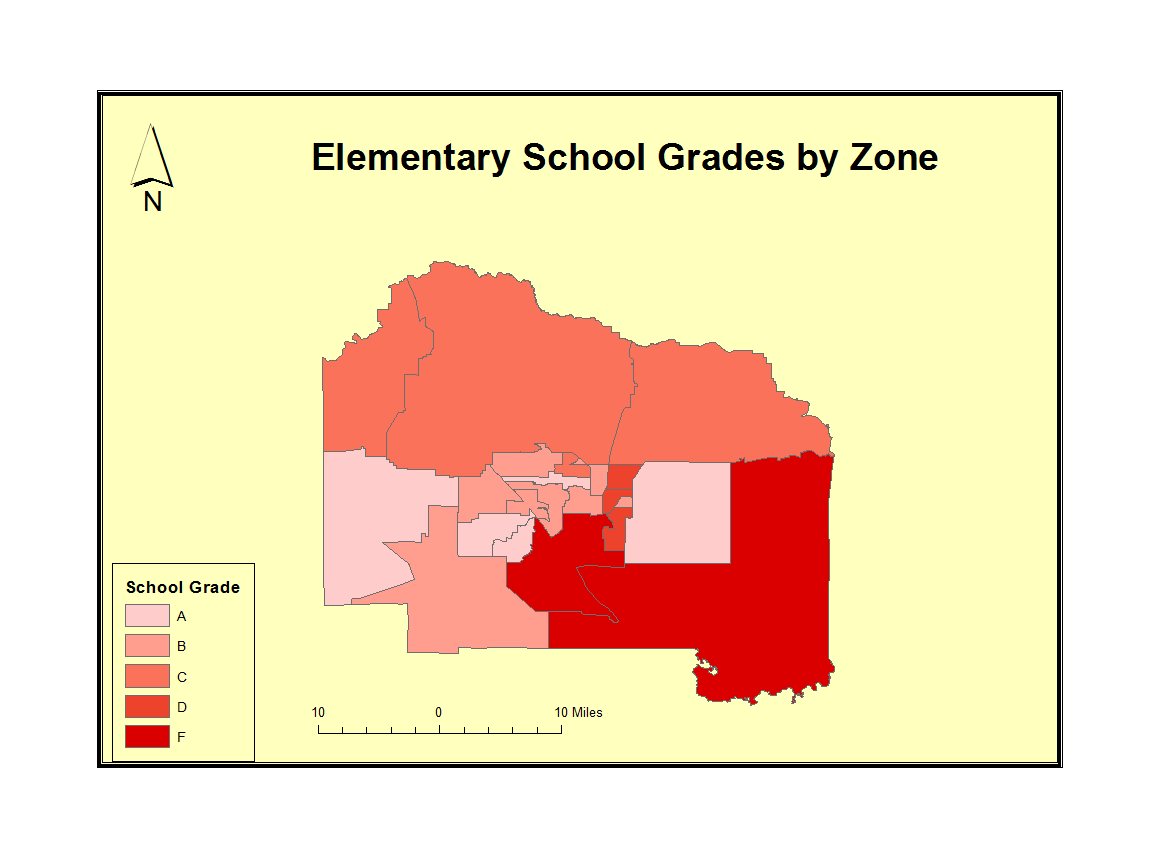
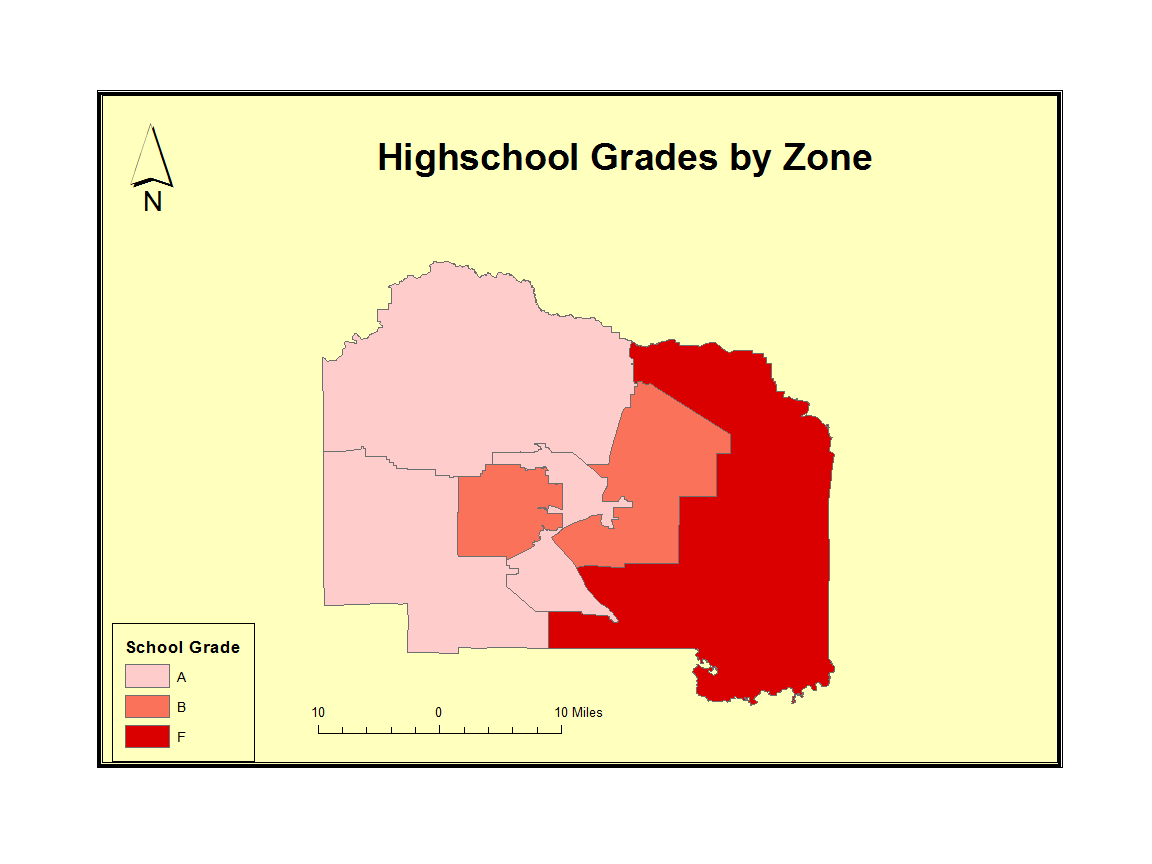
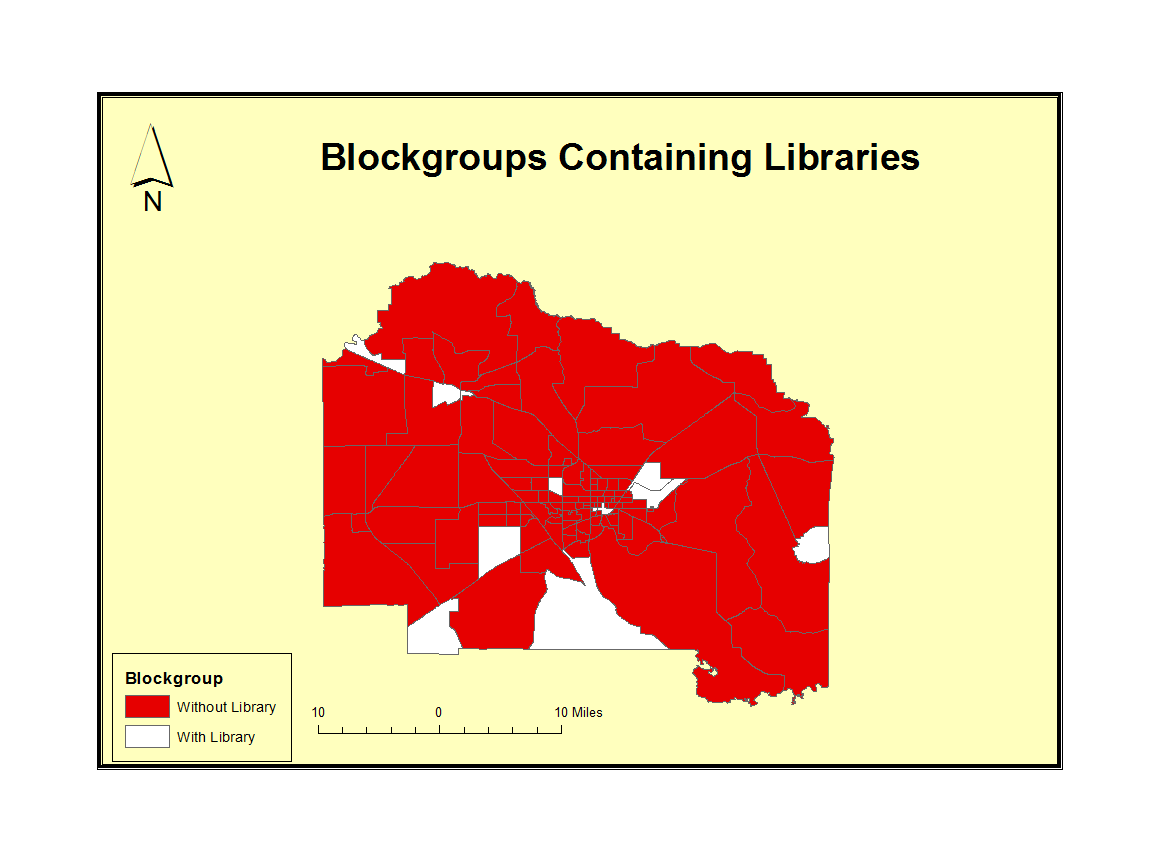
In addition we will also look at if there are libraries or other facilities that aid children in learning extracurricularly. We created a layer by selecting each block group without a library. We gave block groups without a library a risk rank of 5 and block groups with libraries a risk rank of 0.
Finally using the union function in ArcGIS we combined these maps and calculated the risk level by adding the risk levels of unioned maps with the field calculator.
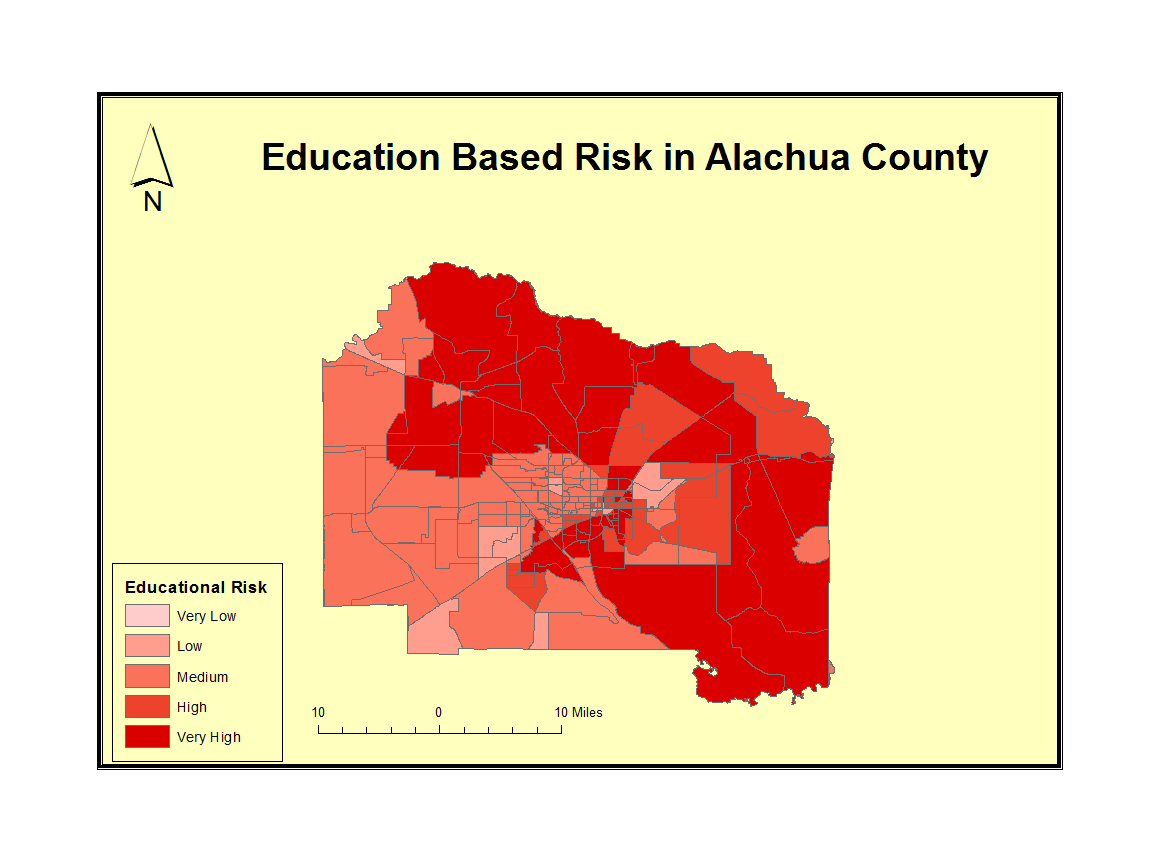
With these factors we will be able to determine where the areas of highest risk will be.
Criteria 2: Socioeconomic
Our project will also aim at identifying high-risk neighborhoods by using socioeconomic rankings. The Alachua county map that we have to our disposal has eleven subcategories under the socioeconomic category. We planned to create acceptable levels for four categories and then selected the areas with the most overlay of each acceptable level layer. For example, we researched the yearly income that is considered below the poverty level first. Then we used that level to create a selection of the block groups with yearly income below the poverty line. In the end, we will have four new layers that meet the acceptable levels that we have decided on. The four categories that will be considered are:
- Net household worth
- Household income
- Household disposable income
- Home value
The thresholds were set at a limit that would select at least 40% of the block groups in Alachua County. The table below shows the thresholds selected and the percentage of block groups that met the threshold.
Category
|
Threshold
|
Block Groups Selected
(121 total)
|
Percentage
|
Household net worth
|
$50,000
|
64
|
52.9
|
Household income
|
$44,000
|
74
|
61.2
|
Household disposable income
|
$30,000
|
52
|
43.0
|
Home Value
|
$125,000
|
71
|
58.7
|
The following maps show the results for each threshold.
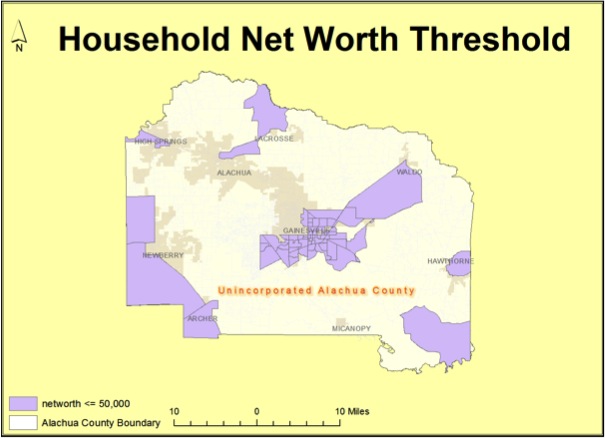
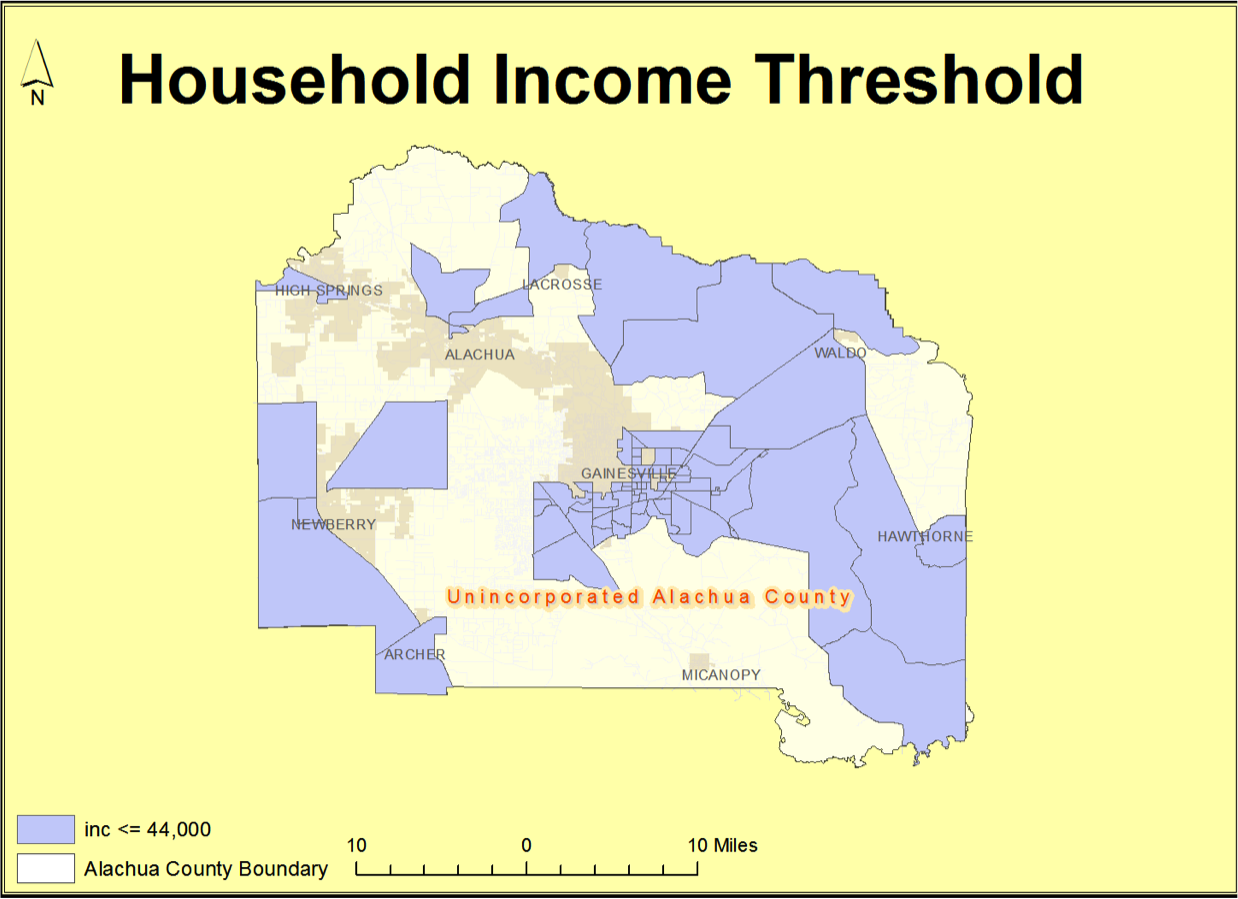
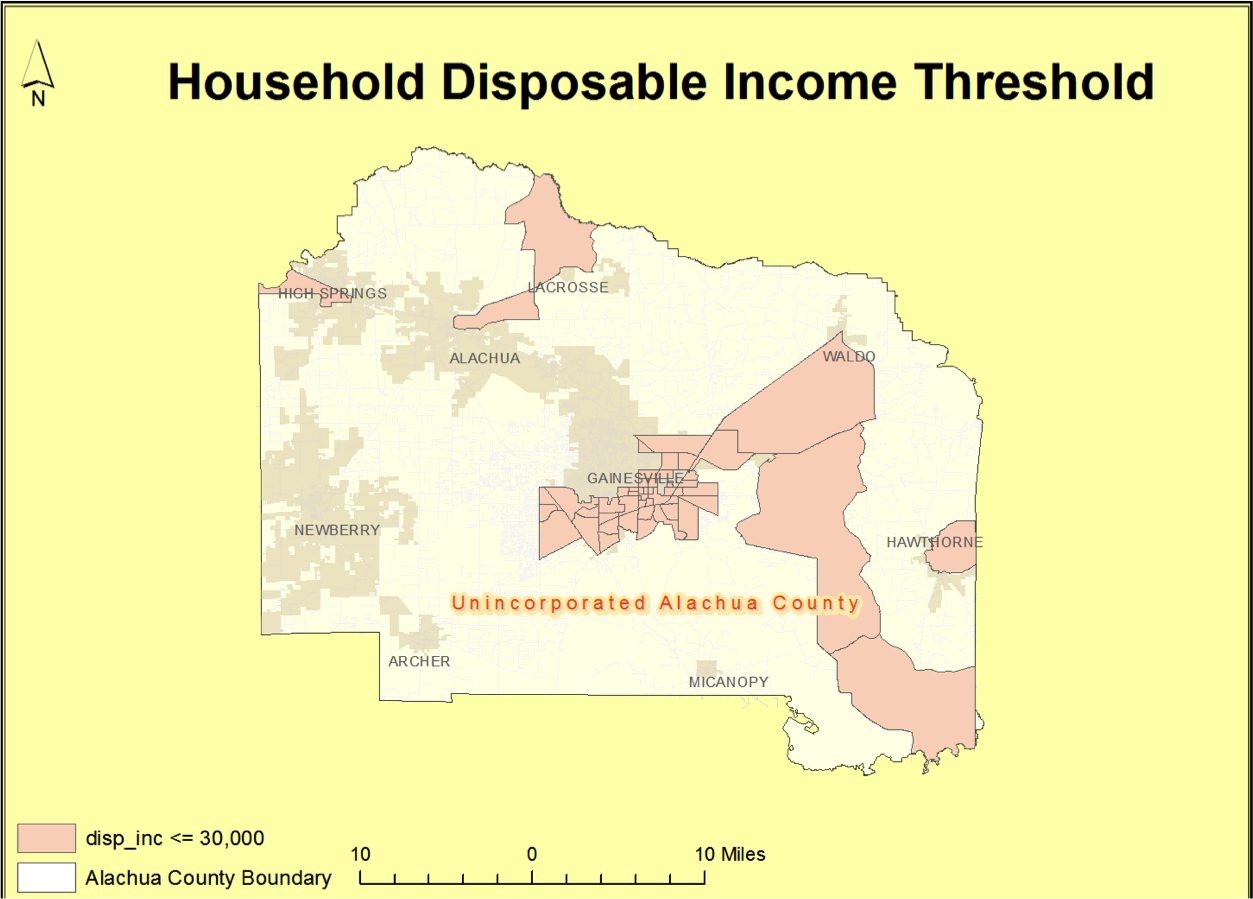
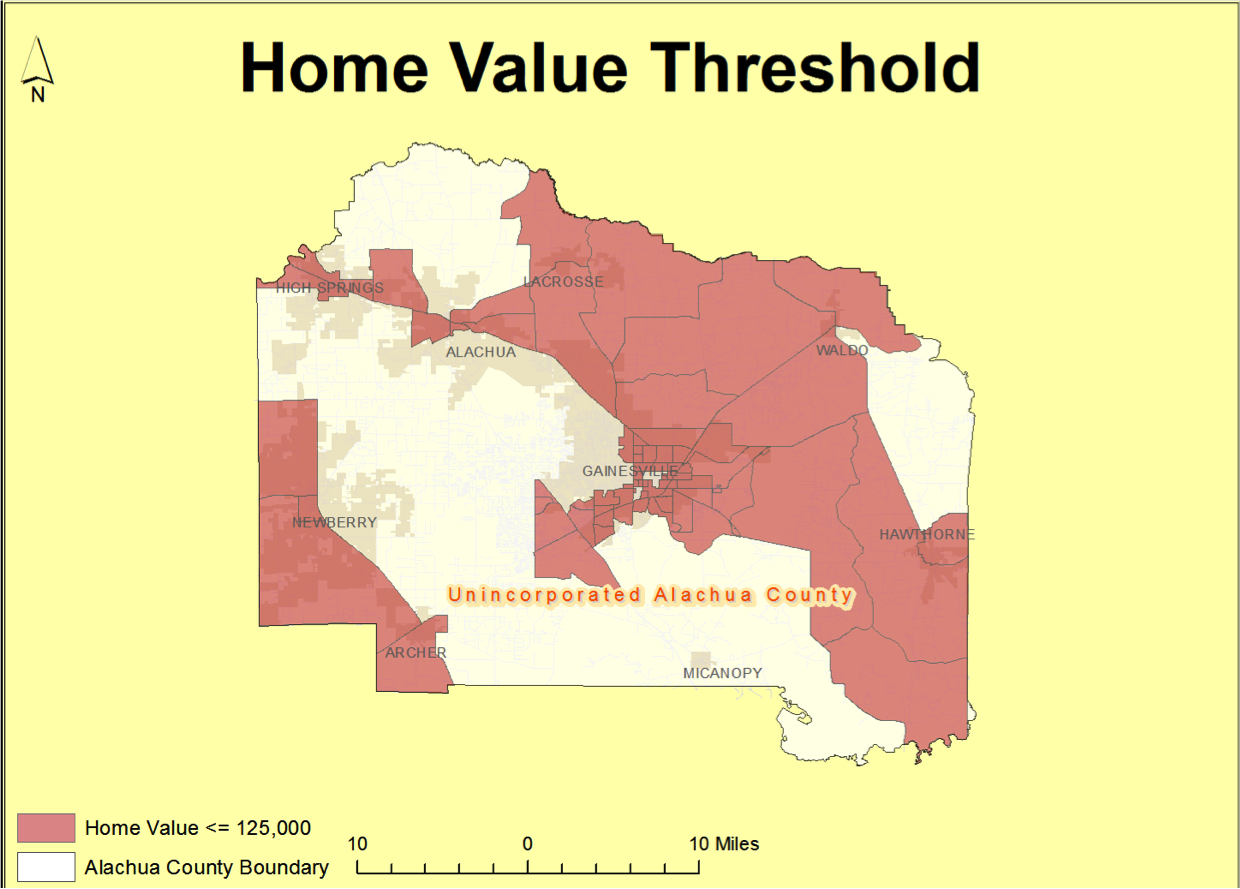
After creating the maps of each threshold, a rank was given to each block group depending on how its value fit in the overall spread of values selected. A rank of 1 was given to the block groups with the highest value, meaning they were the least vulnerable, and a value of 5 was given to those block groups that had the lowest values, meaning they were the most vulnerable.
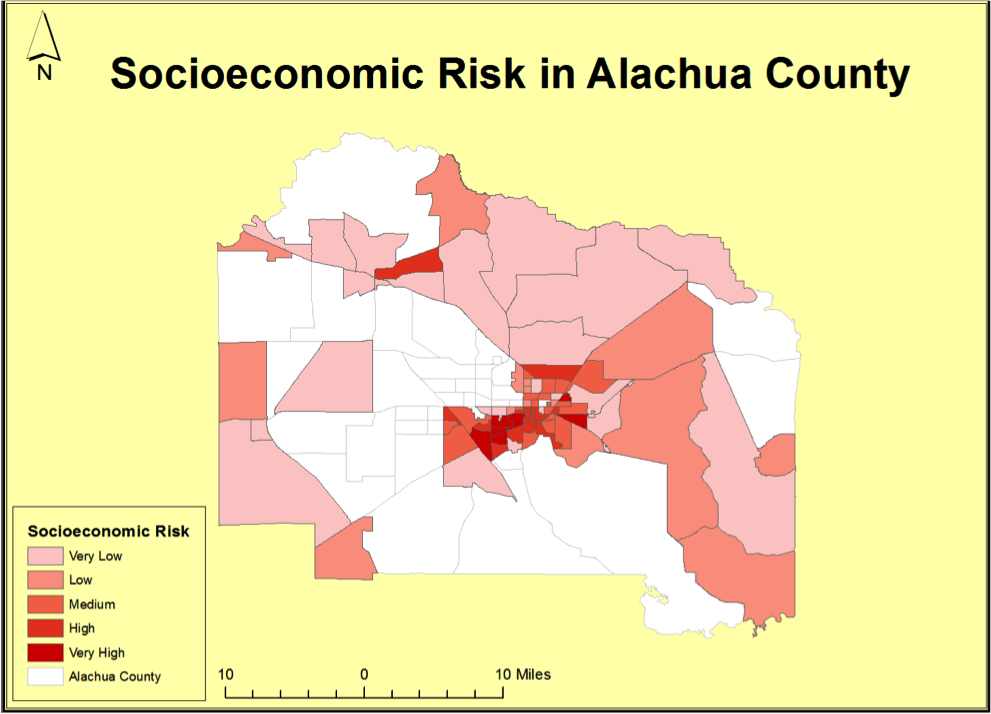
A union of all four maps was done to create a final socioeconomic risk map. The union method created a new attribute table that contained the data from all four input maps. A new field was created a simple addition calculating was added with the field calculator. Therefore, the maximum value of risk for each block group was 20 and the least was 1. Those block groups that were not selected by any of the threshold maps were not considered to be at risk. The final map can be seen below.
Criteria 3: Crime
Starting from the 1970s, studies in the US pointed more and more at the link between unemployment, poverty and crime. After that other connections with income level, time spent at school, quality of neighborhood and education were revealed as well. Fresh research from the UK even indicates that economic cycles may affect variations in property and violent crimes. But most importantly, what reveals the unmistakable connection between poverty and crime is that they’re both geographically concentrated – in a strikingly consistent way. In other words, where you find poverty is also exactly where you find crime (3).
In order to effectively determine areas that contain vulnerable children and families, it is necessary to look at crime in Alachua county. The three criteria that helped define vulnerableneighborhoods were:
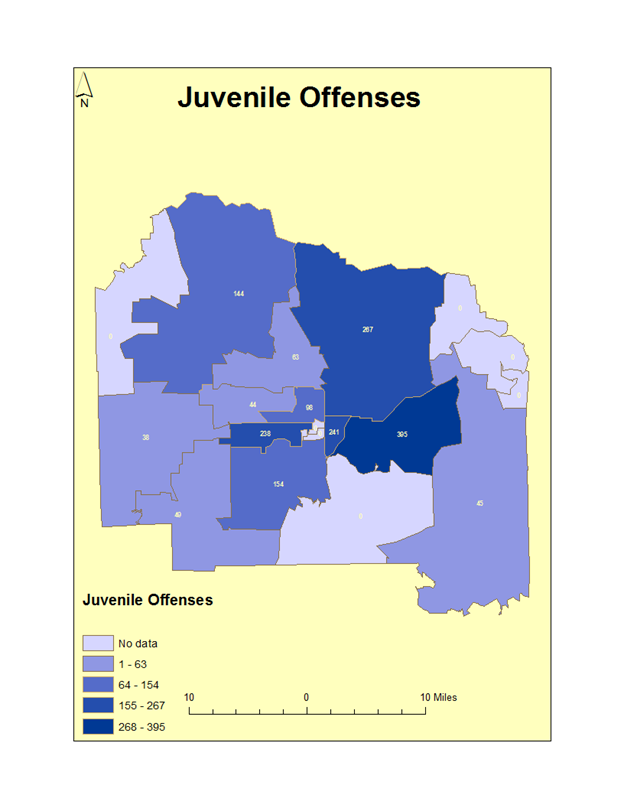
- juvenile offenders by tract
- domestic violence
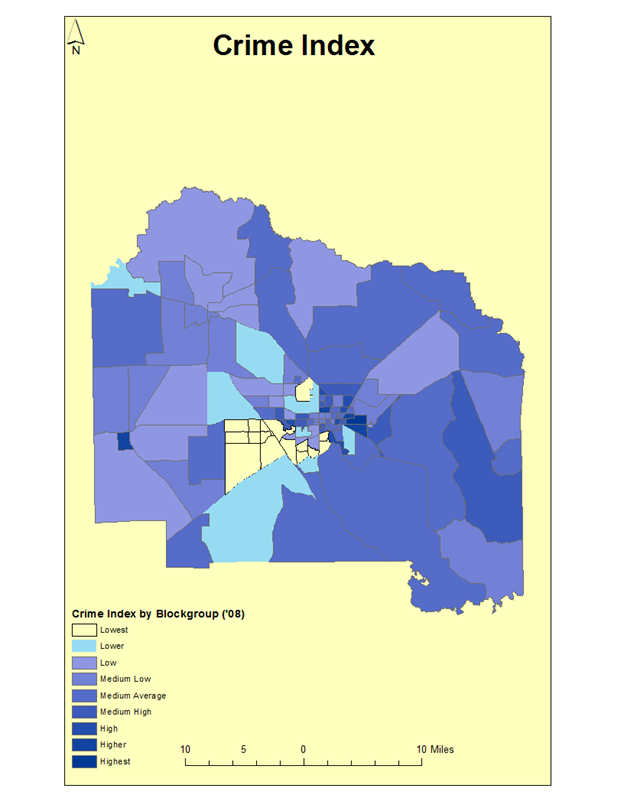
- crime index by blockgroup.
The juvenile offenders by tract showed our group where the highest incidences of juvenile crime were located. An area that had more instances was thus given a higher rating on the risk scale (1-5). The higher the rating, the more vulnerable said neighborhood.
Domestic Violence was a lot more scattered throughout Gainesville and Alachua County. The map of domestic violence suggested that apartment complexes and assisted living areas were subject to a higher rate of violence and abuse. Since violence either occurred in the area or didn’t, an area was given a 5 or a 0 on the risk scale for yes and no respectively. 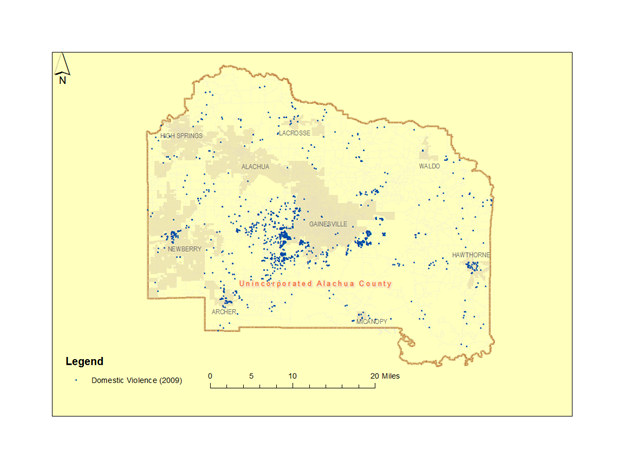
The last criteria was Crime index by Blockgroup. Looking into the metadata showed that there was already a current crime rank formula established for the different types:
◦30% CRMCYMURD Murder
◦20% CRMCYRAPE Rape
◦10% CRMCYROBB Robbery
◦15% CRMCYASST Assault
◦5% CRMCYBURG Burglary
◦10% CRMCYLARC Larceny
◦10% CRMCYMVEH Motor Vehicle Theft
The formula was:
([MURDER] * 0.3) + ([RAPE] * 0.2) + ([ROB] * 0.1) + ([ASSAULT] * 0.15) + ([BURGLARY] * 0.05) + ([LARCENY] * 0.1) + ([MOTORV] * 0.1)
Crime rank was ranked from 1-9. I changed the ranking to a 1-5 scale to fit within our parameters for risk.
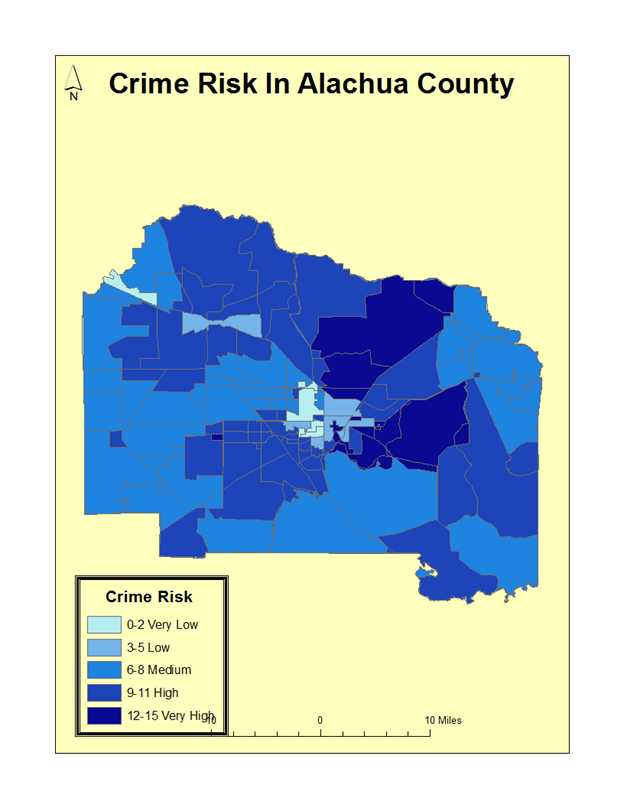
Bringing everything together and creating a union between all three maps led to a final risk assessment respective to crime in Alachua County. The following map displays the highest risk areas.
Criteria 4: Quality of life
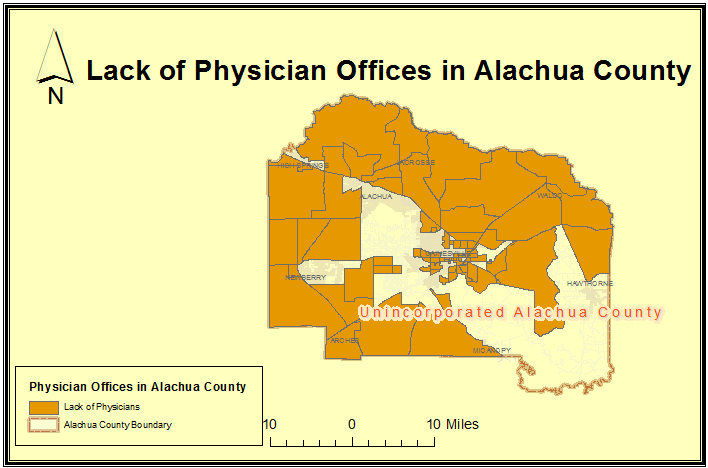
Quality of life can be based off of the amenities, transportation, and grocery within a community. Often times people that live near many amenities have the means to support themselves and spend money on these services. Amenities may include extracurricular activities, physician offices, and religious centers. As for transportation, a smooth running public bus system allows for commute between home and work. A bike route is a safe means to transport oneself with a cheaper investment into a bike rather than a car. Grocery stores provide a good insight as to how much money people are able to spend on meals. There is a significant price difference between a sit in restaurant, fast food locations, and food markets. All of the above are good indicators for community living when considering quality of life.
For this analysis we will be using
· Grocers
· Restaurants and Fast Food
· Religious Centers
· Physician Offices
· Bike Routes
As indicators for quality of life.
The following maps show the results of the analysis used in ArcMap. Selection by location was used for each attribute. The new selection indicated the blocks with the attributes so a swap was performed and gave us the blocks without the attributes.
Food:
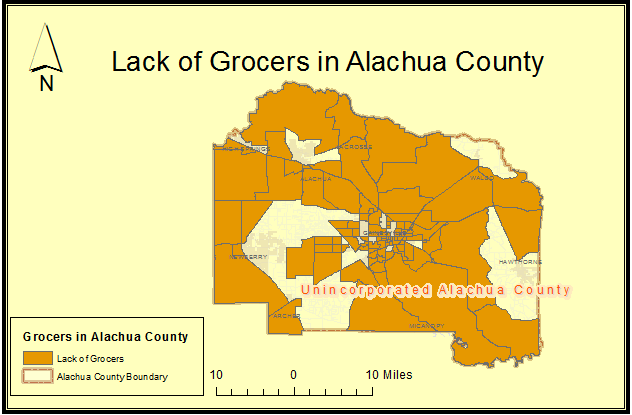
Grocers include supermarkets and other grocery stores.
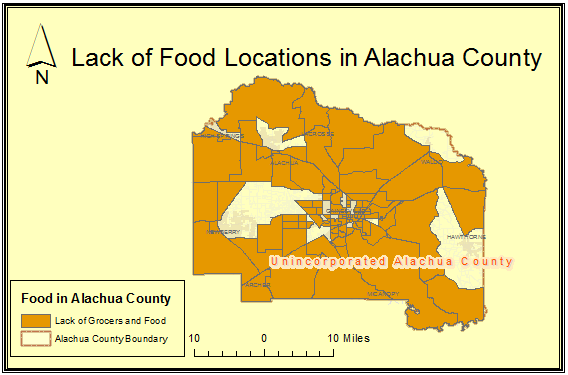
This is a merged layer file of block groups without a grocer or restaurant/fast food close by.
Community Amenities:
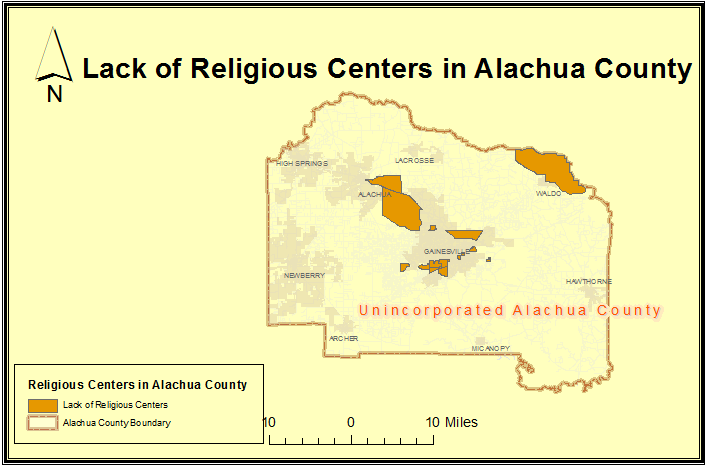
Religious centers include churches, temples, synagogues, mosques, chapels, centers and other types of religious facilities.
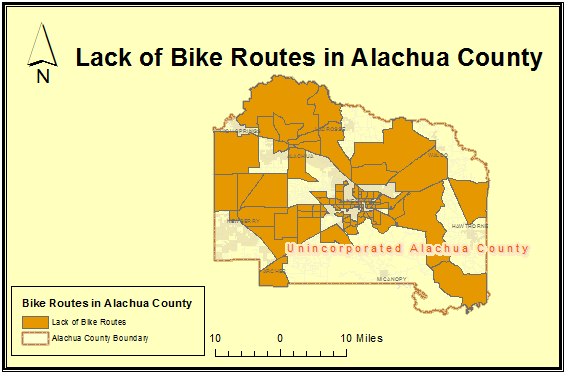
Transportation:
Public bus routes were not used in this study because the bus routes only run in the city of Gainesville. Bike Routes were used instead since purchasing a bike is relatively cheap compared to a vehicle.
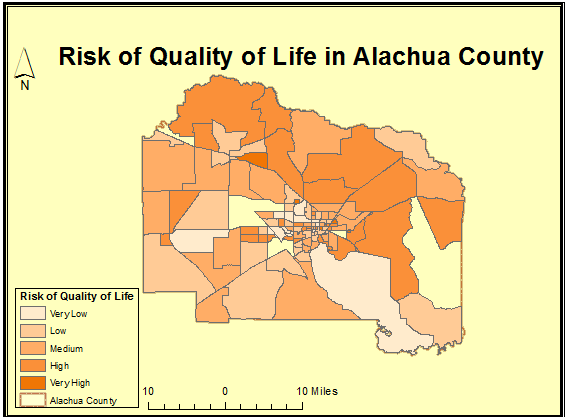
After the maps were individually complete, a field was added to the attributes table to rank them. A scale of 0-5 was used, 0 being the least vulnerable and 5 being most vulnerable. Basically the block either had the quality or it didn’t.
A merge of all five maps was created and a final risk of quality of life was made. In the new merged layer a new field was created and the rows were tallied to get the final number. A higher number was attributed to higher risk. The higher numbers correspond to the darker block groups on the map with the lighter block groups representing less risk.
Final Map
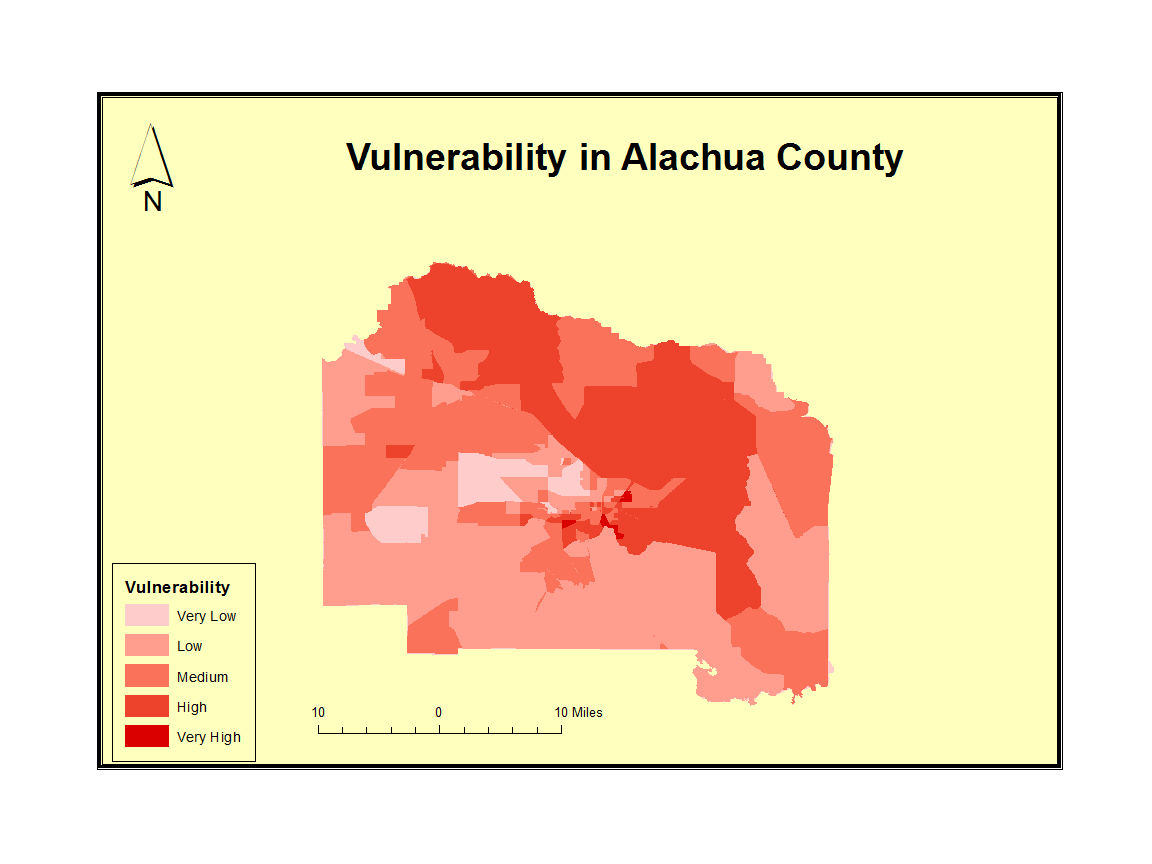
Using the risk levels calculated for each criteria we combined the four maps to create a final map that shows vulnerability in Alachua County. To combine our maps we once again used the union function and added the risk levels using the field calculator.
It can be concluded that the areas of southeast and southwest Gainesville are the areas with the highest risk of being classified as vulnerable. The north and northeast block groups of Alachua County also show vulnerability. We recommend that these vulnerable areas deserve attention by county official, whether that be aimed at increasing education, decreasing crime, or developing the areas.
References
[1]- “Final Project Guide”, Papajorgji, Juna G. PDF. Gainesville, FL: n.p., 23 Apr. 2014.
[2] "LATEST RELEASES." U.S. Bureau of Labor Statistics. U.S. Bureau of Labor Statistics, n.d. Web. 23 Apr. 2014.
[3] "Poverty and Crime: Breaking a Vicious Cycle of Discrimination." Poverties.org. N.p., n.d. Web. 23 Apr. 2014.